Aircraft Range and Endurance: Best Speeds and Fuel Efficiency

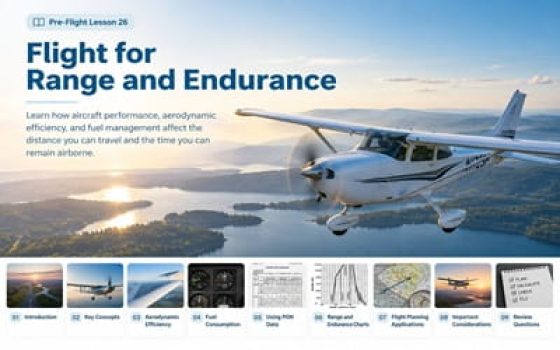
Training airplane flying over a lake with illustrated sections on aircraft range, endurance, aerodynamics, fuel consumption, and flight planning.
Pre-Flight Lesson — Aircraft Performance

Range vs. Endurance: Understanding the Difference

When planning a flight, two important performance questions are: How far can the airplane fly? and How long can it remain airborne?

These questions describe two different concepts: aircraft range and aircraft endurance. Both depend on fuel consumption, but they do not have the same objective.

A pilot flying for maximum range wants to cover the greatest possible distance with the available fuel. A pilot flying for maximum endurance wants to remain airborne for the longest possible time.

Learning Objectives
  • Explain the difference between aircraft range and endurance.
  • Understand why the best range speed and best endurance speed are not necessarily the same.
  • Recognize how lift, drag, power required, and fuel flow affect aircraft performance.
  • Identify how weight, altitude, wind, and aircraft configuration influence range and endurance.
  • Use aircraft performance information from the AFM/POH to make practical flight planning decisions.

Two Different Flight Objectives

Aircraft Range

Distance — Nautical Miles (NM)

Range is the distance an airplane can travel with a given amount of fuel.

The objective of maximum range flight is to obtain the greatest distance from each unit of fuel consumed.

This is often described as specific range, or nautical miles traveled per gallon of fuel.

Practical Example

You want to fly a long cross-country route while using fuel efficiently and maintaining adequate reserves.

Aircraft Endurance

Time — Hours and Minutes

Endurance is the length of time an airplane can remain airborne with a given amount of fuel.

The objective of maximum endurance flight is to remain airborne for the longest possible time by minimizing fuel consumption per hour.

Fuel flow is normally expressed in GPH (gallons per hour) for U.S. general aviation airplanes.

Practical Example

You need to remain airborne for additional time, such as during a delay, while still protecting the fuel required for a safe landing.

Maximum Range vs. Maximum Endurance

For a typical propeller-driven training airplane, the speed that provides the best fuel economy over a distance is generally different from the speed that provides the lowest fuel consumption per hour.

Comparison Maximum Range Maximum Endurance
Main Objective Fly the greatest distance with the available fuel. Remain airborne for the longest time.
Efficiency Measure Distance per unit of fuel (for example, NM/gal). Fuel consumption per hour (GPH).
Speed Objective Best range speed. Best endurance speed.
Pilot's Main Question How many nautical miles can I cover? How many hours can I remain in flight?
Important: Wind and Fuel Reserves

Wind affects the distance an aircraft can travel over the ground. A headwind reduces ground range, while a tailwind increases it, if other conditions remain the same. Wind does not directly change airborne endurance at an unchanged fuel flow.

Maximum theoretical range and endurance do not represent usable flight planning limits. Always account for fuel reserves, aircraft limitations, and actual operating conditions.

Key Takeaway

Range is about distance. Endurance is about time. The best operating condition depends on which objective the pilot is trying to achieve. Always use the aircraft's AFM/POH when selecting actual cruise and fuel planning settings.

Aircraft Performance — Aerodynamics

Lift-to-Drag Ratio (L/D MAX) and Power Required

Aircraft range and endurance depend on how efficiently an airplane moves through the air and how much power its engine needs to maintain flight.

The relationship between lift, drag, airspeed, and power required helps explain why maximum range and maximum endurance involve different operating conditions.

What Is the Lift-to-Drag Ratio?

The lift-to-drag ratio (L/D) compares the aerodynamic lift produced by an airplane with the drag opposing its motion through the air.

Lift

Lift is the aerodynamic force generated by the wings that acts perpendicular to the relative airflow.

Supports the airplane in level flight

Drag

Drag is the aerodynamic force that opposes the airplane's movement relative to the surrounding air.

Must be overcome to maintain flight

L/D Ratio

The ratio shows how much lift the airplane produces compared with the drag it experiences.

Higher L/D = Better aerodynamic efficiency
L/D Ratio = Lift ÷ Drag L/D MAX is the greatest lift-to-drag ratio achievable in the relevant flight configuration.

Why Does a Higher L/D Ratio Matter?

Compare two simplified examples with the same lift but different drag.

Higher L/D

Lift
Drag
80 ÷ 20 = L/D of 4

Lower L/D

Lift
Drag
80 ÷ 40 = L/D of 2
Illustrative values only, not actual aircraft performance data. The same amount of lift with less drag gives a higher L/D ratio.

How Does Drag Change with Airspeed?

In steady, level flight, the airplane must produce enough lift to support its weight. The total drag changes as airspeed changes.

Two important types of drag explain this relationship.

Induced Drag

Induced drag is associated with lift production.

At lower airspeeds, the wing generally needs a higher angle of attack to maintain level flight.

This increases induced drag.

Lower Airspeed → Higher Induced Drag

Parasite Drag

Parasite drag includes form drag, skin-friction drag, and interference drag.

It increases as the airplane moves faster through the air.

At higher speeds, parasite drag becomes increasingly important.

Higher Airspeed → Higher Parasite Drag
Total Drag = Induced Drag + Parasite Drag Total drag is influenced by both components.

Understanding L/D MAX and Minimum Drag

At low airspeeds, induced drag is high. At high airspeeds, parasite drag is high. Between these two extremes, total drag reaches a minimum.

In steady, level flight, at a given weight and configuration, minimum total drag occurs at the maximum lift-to-drag ratio (L/D MAX).

The original StudyFlight diagrams below illustrate aerodynamic performance. To understand their meaning, identify the axes, follow the curves, and locate the most efficient condition.

Original aircraft aerodynamics chart showing performance relationships
Original aircraft lift-to-drag performance diagram

How to Read the Aerodynamic Diagrams

The important information is not simply where a curve rises or falls, but what each axis and curve represents. Different aerodynamic diagrams may use airspeed, angle of attack, drag, or aerodynamic coefficients.

01

Identify the Axes

On a drag-versus-airspeed graph, the horizontal axis shows airspeed, increasing toward the right. The vertical axis shows drag, increasing upward.

02

Follow the Drag Curves

Induced drag generally decreases as speed increases. Parasite drag increases with speed. Their sum forms a total-drag curve with a low point.

03

Find Minimum Total Drag

Locate the lowest point of the total-drag curve. Move vertically down to the airspeed axis to identify the corresponding minimum-drag speed.

04

Connect It to L/D MAX

In steady, level flight, lift is approximately equal to weight. For a fixed weight, reducing total drag increases L/D. Therefore, the minimum-drag point corresponds to L/D MAX.

Visual Guide: Minimum Drag and L/D MAX

A simplified drag-versus-airspeed curve showing how to identify its minimum point.

Minimum Drag L/D MAX Low Speed High Speed Airspeed → Total Drag → Minimum-Drag Speed
If a Diagram Uses Angle of Attack Instead of Airspeed

Some aerodynamic diagrams plot the coefficient of lift (CL) and coefficient of drag (CD) against angle of attack.

In that case, L/D MAX corresponds to the angle of attack at which CL divided by CD is greatest. It does not necessarily occur where lift alone reaches its maximum.

The optimum angle of attack and the associated airspeed are related, but they are not the same measurement.

Why Is Minimum Power Different from Minimum Drag?

Drag is the aerodynamic force opposing the airplane's movement. Power required describes the rate at which work must be done to overcome that drag.

For a typical light propeller-driven airplane, the minimum aerodynamic power required occurs at a lower airspeed than the minimum-drag speed.

Minimum Drag — L/D MAX

The airplane experiences the lowest total aerodynamic drag in steady, level flight.

Under simplified assumptions about engine and propeller efficiency, this condition is associated with maximum range.

Higher of the Two Airspeeds

Minimum Power Required

The airplane needs the lowest aerodynamic power to maintain steady, level flight.

Under simplified fuel-efficiency assumptions, this condition is associated with maximum endurance.

Lower of the Two Airspeeds
Important for Student Pilots

Aerodynamic diagrams explain the principles behind range and endurance. They do not automatically provide a safe operating speed for a particular airplane.

Actual optimum settings depend on aircraft weight, configuration, altitude, engine characteristics, and propeller efficiency. Use the aircraft's AFM/POH and maintain adequate margins above stall.

Key Takeaway

On a drag-versus-airspeed graph, find the lowest point of the total-drag curve. In steady, level flight at a fixed weight, this identifies the condition for L/D MAX. Minimum power occurs at a different, generally lower airspeed for a typical propeller-driven airplane.

Aircraft Performance — Maximum Range

Flight for Maximum Range

Maximum range flight aims to cover the greatest possible distance with a given amount of fuel. The pilot must select an operating condition that provides the best balance between airspeed and fuel consumption.

Flying faster does not always increase the distance you can travel. A higher cruise speed may require considerably more fuel per hour, reducing the distance available from each gallon.

The Goal of Maximum Range Flight

Obtain the greatest number of nautical miles per gallon (NM/gal) without compromising the fuel reserves required for a safe flight.

Specific Range: Distance per Gallon of Fuel

Specific range measures how far an airplane travels for each unit of fuel consumed. For many U.S. training airplanes, it can be expressed in nautical miles per gallon (NM/gal).

In still air, you can estimate specific range by dividing true airspeed (TAS) by fuel flow (GPH).

Still-Air Specific Range Specific Range (NM/gal) = TAS (kt) ÷ Fuel Flow (GPH) TAS is expressed in knots (NM per hour). Fuel flow is expressed in gallons per hour. Dividing them gives nautical miles per gallon.
True Airspeed TAS (kt)

How many nautical miles the airplane travels through the air in one hour.

Fuel Consumption GPH

How many gallons of fuel the engine consumes in one hour.

Fuel Efficiency NM/gal

How many nautical miles the airplane travels for each gallon consumed.

Comparing Three Cruise Settings

Consider an imaginary single-engine training airplane with three possible cruise settings. Each setting provides a different combination of true airspeed and hourly fuel consumption.

To identify the most efficient of these three settings, calculate the specific range for each one.

Cruise Setting TAS Fuel Flow Specific Range
Lower Speed 90 kt 6 GPH 15.0 NM/gal
Moderate Speed Best of These Three 110 kt 7 GPH 15.7 NM/gal
Higher Speed 125 kt 9.5 GPH 13.2 NM/gal
Illustrative data only. These figures are hypothetical and do not represent the cruise performance of any particular airplane or AFM/POH.
How Cruise Speed Affects Specific Range

More speed does not always mean more distance per gallon.

17 16 15 14 13 15.7 NM/gal Best of These Examples 90 kt 110 kt 125 kt True Airspeed (kt) Specific Range (NM/gal)
The plotted values are fictional. The highest of three sampled settings does not necessarily identify an aircraft's exact maximum-range speed.

How to Interpret the Results

01

Lower Speed Is Not Always Best

At 90 kt, the airplane consumes 6 GPH and achieves 15.0 NM/gal. It uses less fuel per hour, but it also covers less distance during that hour.

02

Find the Best Balance

At 110 kt, the airplane consumes 7 GPH and achieves approximately 15.7 NM/gal. This is the highest specific range among the three settings.

03

Higher Speed Can Cost More Fuel

At 125 kt, fuel consumption increases to 9.5 GPH. Although the airplane flies faster, its specific range drops to approximately 13.2 NM/gal.

Calculating Range from Available Cruise Fuel

Once the specific range is known, it can be used to estimate how far the airplane could travel on a specified amount of cruise fuel in still air.

For this example, assume 18 gallons have been allocated specifically to cruise flight, after separately accounting for other flight phases, required reserves, and additional planned margins.

Step 1 — Calculate Specific Range

Use the most efficient of the three hypothetical cruise settings.

TAS: 110 kt

Fuel Flow: 7 GPH

110 ÷ 7 = 15.7 NM/gal

This is the estimated distance traveled per gallon in still air.

Step 2 — Estimate Cruise Range

Multiply the unrounded specific range by the fuel allocated to cruise.

Cruise Fuel: 18 gallons

Specific Range: 110 ÷ 7 NM/gal

(110 ÷ 7) × 18 ≈ 283 NM

This is a simplified still-air cruise-distance estimate, not the airplane's certified range or a complete flight fuel plan.

Why This Is Not the Total Flight Range

The calculation assumes a constant cruise setting and no wind. An actual flight also requires planning for ground operations, climb, descent, weather, fuel reserves, and possible delays.

For the distance traveled over the ground, the relevant speed is groundspeed, not TAS. The effect of wind will be examined in the next chapter, Factors Affecting Aircraft Range.

How Do Pilots Select a Best Range Cruise Setting?

01

Consult the AFM/POH

Review the aircraft's cruise performance information for the expected altitude, temperature, weight, and engine operating conditions.

02

Compare Speed and Fuel Flow

Use the published TAS and fuel consumption figures to compare specific range, or follow the manufacturer's recommended economy-cruise setting.

03

Check Operational Suitability

Consider actual winds, fuel reserves, engine limitations, safe operating speeds, and the suitability of the planned flight.

Key Takeaway

Maximum range is about getting the greatest distance from each unit of fuel. The most efficient cruise setting is not necessarily the slowest or the fastest. Compare speed with fuel flow, then use the aircraft's AFM/POH and actual flight conditions to select a safe operating setting.

Aircraft Performance — Range Factors

Factors Affecting Aircraft Range

The maximum range of an aircraft is not a fixed distance that applies to every flight. It changes with the airplane's weight, operating altitude, wind conditions, engine settings, and available fuel.

Understanding these factors helps pilots estimate how far an airplane can travel and select suitable cruise conditions for a planned flight.

Fuel Efficiency Through the Air

Aircraft performance determines how far the airplane can travel through the air for each gallon of fuel consumed.

Weight, altitude, configuration, and engine settings can change the relationship between true airspeed and fuel flow.

TAS (kt) ÷ Fuel Flow (GPH) = Still-Air NM/gal

Distance Traveled Over the Ground

Wind changes the airplane's groundspeed, even when its true airspeed and fuel flow remain unchanged.

A headwind reduces the distance covered per gallon over the ground. A tailwind increases it.

GS (kt) ÷ Fuel Flow (GPH) = Ground NM/gal

1. Aircraft Weight and Center of Gravity

Aircraft loading influences the lift required for flight, the resulting drag, and overall fuel efficiency.

Aircraft Weight

A heavier airplane requires more lift to remain in steady, level flight.

At a given airspeed, producing additional lift generally increases induced drag.

More drag may require additional power and fuel, reducing the distance traveled per gallon.

More Weight → Generally More Induced Drag
Effect of aircraft weight on aerodynamic performance and range

Center of Gravity (CG)

Center of gravity affects aircraft balance and trim.

In a conventional-tail airplane, a forward CG may require greater downward tail force.

The wing may then need to produce additional lift, which can increase drag.

What the Pilot Should Do

Complete the weight-and-balance calculation before flight.

Keep total weight and CG within the approved limits.

Use performance data appropriate for the airplane's actual loading condition.

2. Altitude and Air Density

Altitude affects air density, true airspeed, available engine power, and the fuel required to reach the selected cruising altitude.

At higher altitudes, an airplane may achieve a higher true airspeed for a comparable indicated airspeed. However, a normally aspirated engine also loses available power as air density decreases.

Climbing higher does not automatically increase range. The result depends on aircraft performance, cruise conditions, engine efficiency, wind, and the fuel consumed during climb.

01

Compare Cruise Performance

Review AFM/POH cruise tables for the expected pressure altitude, temperature, and engine setting.

02

Account for the Climb

Higher cruising altitudes require additional climb time and fuel before level cruise begins.

03

Consider Winds Aloft

Favorable winds may make one altitude more economical than another.

Choosing a Cruising Altitude

For a relatively short flight, the fuel spent climbing higher may offset any cruise efficiency benefit.

For a longer flight, favorable cruise performance or stronger tailwinds aloft may justify the additional climb.

Altitude selection must also account for terrain, weather, airspace, aircraft limitations, and applicable VFR altitude rules.

3. Wind: The Difference Between Airspeed and Groundspeed

Wind is one of the most important factors affecting the distance an airplane can travel over the ground.

True airspeed (TAS) describes speed through the surrounding air. Groundspeed (GS) describes speed relative to the ground.

A headwind reduces groundspeed, while a tailwind increases it. With unchanged fuel flow, this changes the number of nautical miles traveled per gallon.

Effects of headwind and tailwind on aircraft groundspeed
No Wind →
120 kt GS

With 120 kt TAS and no wind, groundspeed equals true airspeed.

Tailwind → →
140 kt GS

A direct 20 kt tailwind increases groundspeed by 20 knots.

Headwind ← →
100 kt GS

A direct 20 kt headwind reduces groundspeed by 20 knots.

Ground Distance per Gallon Ground Specific Range (NM/gal) = GS (kt) ÷ Fuel Flow (GPH) Use wind-corrected groundspeed to estimate distance over the ground.

Example: The Same Airplane in Different Wind Conditions

Consider the hypothetical cruise setting from the previous chapter: 110 kt TAS and 7 GPH fuel flow. Compare three wind conditions.

20 kt Headwind 12.9 NM/gal
90 kt GS ÷ 7 GPH
No Wind 15.7 NM/gal
110 kt GS ÷ 7 GPH
20 kt Tailwind 18.6 NM/gal
130 kt GS ÷ 7 GPH
All three cases assume the same TAS and fuel flow. Values are illustrative and rounded to one decimal place.
Does Wind Change the Best Range Speed?

The airspeed that maximizes distance over the ground can differ from the best still-air range speed.

In general, optimum airspeed for maximum ground range increases with a headwind and decreases with a tailwind.

The appropriate adjustment depends on the airplane's performance characteristics and operating limitations.

4. Mixture and Engine Efficiency

In a piston-engine airplane equipped with a mixture control, the fuel-air mixture influences fuel consumption, engine performance, and operating temperatures.

Appropriate leaning during cruise can improve fuel economy and increase range when performed according to the manufacturer's procedures.

Mixture requirements vary with engine design, power setting, altitude, temperature, and fuel system.

Economy Cruise

The AFM/POH may provide economy-cruise performance tables or specific mixture instructions.

These figures help evaluate the relationship between cruise speed and fuel flow.

Use the published procedures for the actual engine and power setting.

Engine Operating Limits

Do not apply one generic mixture procedure to every engine.

Carbureted, fuel-injected, turbocharged, and electronically controlled engines may have different requirements.

Follow manufacturer guidance for mixture adjustment, engine monitoring, climb, descent, and landing.

5. Airspeed and Aircraft Configuration

Flying substantially faster than an economical cruise setting can reduce range if the additional fuel consumption outweighs the increase in speed.

Aircraft configuration also influences efficiency. Extended landing gear, deployed flaps, and other drag-producing configurations can increase the power needed to maintain flight.

Normal Cruise Configuration

Use approved cruise configurations and power settings.

A clean configuration generally reduces unnecessary aerodynamic drag.

Follow the aircraft manufacturer's instructions and limitations.

Additional Drag

Drag-producing configurations may require additional power to maintain a given airspeed.

Safety and aircraft operating requirements always take priority over fuel economy.

6. Climb Fuel and Available Fuel

An airplane's cruise range is not the same as its total flight range.

Fuel is consumed during ground operations, takeoff, climb, and other phases of flight. The amount remaining for cruise affects the distance available at the selected cruise setting.

Range calculations must use usable fuel, rather than total tank capacity, and must preserve required reserves and appropriate contingency margins.

✓

Usable fuel: Check the published usable fuel capacity and actual fuel quantity.

✓

Climb fuel: Use AFM/POH performance information to estimate fuel consumed before cruise.

✓

Cruise fuel: Estimate route consumption using expected groundspeed and fuel flow.

✓

Fuel reserves: Preserve the fuel required by applicable regulations and suitable additional margins.

✓

Changing conditions: Reassess the plan when weather, delays, routing, or fuel consumption differ from expectations.

Key Takeaway

Aircraft range depends on more than cruise speed and fuel flow. Weight, CG, altitude, wind, mixture, configuration, climb requirements, and usable fuel affect the final result. Combine aircraft-specific AFM/POH performance data with actual flight conditions and appropriate fuel reserves.

Aircraft Performance — Maximum Endurance

Flight for Maximum Endurance

Maximum endurance flight aims to keep an airplane airborne for the longest possible time with a given amount of fuel. Unlike maximum range, the objective is not to cover the greatest distance.

To maximize endurance, the pilot seeks an operating condition that minimizes fuel consumption per hour, while maintaining safe, controlled, level flight within the aircraft's operating limitations.

Maximize Flight Time

Endurance is measured in hours and minutes.

The main question is how long the airplane can remain airborne using the fuel available for a particular flight condition.

Objective: Longest Flight Time

Minimize Hourly Fuel Flow

Fuel consumption is expressed in gallons per hour (GPH) for many U.S. training airplanes.

With the same usable fuel allocation, a lower fuel flow generally provides more time in flight.

Objective: Lowest Practical GPH

Best Endurance Speed and Minimum Power Required

For a typical propeller-driven training airplane, the fuel flow required to maintain steady, level flight is closely related to engine power.

The aerodynamic power required changes with airspeed. At very low airspeeds, induced drag is high. At higher airspeeds, parasite drag becomes increasingly important.

Between these regions is a minimum-power condition. Under simplified assumptions about engine and propeller efficiency, this corresponds to the lowest hourly fuel flow and therefore the greatest endurance.

Understanding the Power-Required Curve

Identify the lowest point of the curve to understand the best endurance condition.

Minimum Power Best Endurance Low Speed High Speed Airspeed → Power Required →
Schematic relationship only. Actual power-required curves depend on the airplane and flight conditions.
Aircraft endurance and power required diagram
Hover over the image to enlarge

Too Slow

At very low airspeed, the required angle of attack and induced drag become high. Maintaining level flight may require more power again.

Slower Does Not Always Mean Less Power

Minimum Power

At the minimum-power point, the airplane needs the least aerodynamic power to maintain steady, level flight.

Theoretical Best Endurance Condition

Too Fast

At higher speeds, parasite drag increases. Additional power is needed, generally increasing hourly fuel consumption.

More Power Generally Means Higher GPH
Important: Best Endurance Is Not Minimum Safe Airspeed

The theoretical minimum-power speed must not be confused with the slowest speed at which an airplane can remain airborne.

Actual operating settings must respect stall margins, aircraft limitations, controllability, and the procedures in the AFM/POH.

Calculating Endurance from Fuel Flow

Once the fuel flow is known, the available flight time can be estimated by dividing the fuel allocated to the flight condition by the hourly fuel consumption.

Unlike a range calculation, airspeed is not needed to calculate endurance when fuel flow is already known.

Endurance Calculation Endurance (hours) = Available Fuel (gal) ÷ Fuel Flow (GPH) This simplified calculation assumes a constant fuel flow during the period being evaluated.

Example: Which Cruise Setting Gives the Longest Time?

Use the same hypothetical cruise settings introduced in the maximum-range chapter.

Assume that 18 gallons have been allocated specifically to level-flight operation, after separately accounting for other flight phases, required fuel reserves, and appropriate margins.

Compare the estimated duration at each constant fuel-flow setting.

Lower-Speed Setting 90 kt TAS · 6 GPH 3 h 00 min
18 ÷ 6 = 3.00 hours Longest of These Three
Moderate-Speed Setting 110 kt TAS · 7 GPH 2 h 34 min
18 ÷ 7 ≈ 2.57 hours
Higher-Speed Setting 125 kt TAS · 9.5 GPH 1 h 54 min
18 ÷ 9.5 ≈ 1.89 hours
The fuel flows, speeds, and available fuel are hypothetical. The lowest fuel flow among three settings does not necessarily identify an aircraft's actual maximum-endurance operating condition.

Notice the difference from the previous maximum-range example. The 110 kt setting gave the best distance per gallon among the three settings.

However, the 90 kt setting at 6 GPH provides the longest estimated level-flight time from the same 18 gallons of allocated fuel.

Converting Decimal Hours into Hours and Minutes

Endurance calculations often produce a decimal number of hours. The decimal portion must be converted into minutes to obtain a practical flight-time estimate.

Step 1 — Calculate the Hours

At a constant fuel flow of 7 GPH, with 18 gallons allocated to level flight:

18 ÷ 7 ≈ 2.57 hours

This is approximately 2 whole hours, plus a fraction of an hour.

Step 2 — Convert to Minutes

Multiply the fractional portion of the hour by 60, using the unrounded result for accuracy.

(18 ÷ 7 − 2) × 60 ≈ 34 min

The estimated duration is 2 hours and 34 minutes.

Applying Maximum Endurance in Flight

Endurance becomes particularly important when a pilot needs to remain airborne temporarily, such as while waiting for an airport to become available.

The objective is to manage the remaining fuel safely, not to continue flying until all usable fuel has been consumed.

01

Check Remaining Fuel

Confirm the estimated fuel on board and retain the fuel required to reach a suitable landing airport with appropriate reserves.

02

Use Approved Settings

Consult the AFM/POH for suitable low-power operation, airspeeds, and mixture settings. Maintain safe control and stall margins.

03

Reassess the Situation

Monitor time and fuel consumption, evaluate landing alternatives, and make a timely diversion decision when needed.

Wind and Endurance

At an unchanged fuel flow, a headwind or tailwind does not directly change how long the airplane can remain airborne.

Wind does change the distance covered over the ground during that time. The practical implications of wind, weight, altitude, and configuration will be examined in the next chapter.

Key Takeaway

Maximum endurance means obtaining the greatest flight time from the available fuel. For a typical propeller-driven airplane, this is associated with minimum hourly fuel consumption. Calculate endurance using fuel quantity divided by fuel flow, and use the AFM/POH to select safe, aircraft-specific operating conditions.

Aircraft Performance — Endurance Factors

Factors Affecting Endurance

Aircraft endurance depends primarily on the amount of fuel available and the rate at which the engine consumes that fuel.

Weight, power setting, altitude, turbulence, aircraft configuration, and engine operation can all influence the hourly fuel consumption required to maintain flight.

Fuel Available

More fuel allocated to the relevant phase of flight can provide more endurance, provided the aircraft remains within weight-and-balance limits.

Required reserves must remain protected when evaluating usable operating time.

Hourly Fuel Consumption

At a given fuel allocation, a lower fuel flow allows the airplane to remain airborne for a longer period.

Endurance decreases when additional power or inefficient operating conditions increase the amount of fuel consumed per hour.

1. Power Setting and Airspeed

Engine power has a direct influence on fuel consumption. Higher power settings generally require more fuel per hour, particularly when other operating conditions remain similar.

However, reducing power does not necessarily improve endurance indefinitely. If the airplane becomes too slow, the power needed to maintain level flight increases again.

More Power Required Higher engine demand
→
Higher Fuel Flow More gallons per hour
→
Less Endurance Shorter available flight time
Finding an Appropriate Power Setting

The best-endurance operating condition is related to minimum fuel consumption per hour, not simply to the lowest possible RPM or airspeed.

Use the aircraft's AFM/POH for approved power settings, airspeeds, and engine operating procedures.

2. Weight and Maneuvering Flight

Greater aircraft weight requires more lift to maintain flight. This generally increases the minimum power needed to support the airplane.

Endurance may also be affected by maneuvering. In a coordinated, level turn, the wing must generate additional total lift to maintain altitude.

Higher Aircraft Weight

A heavier aircraft generally needs more aerodynamic power to remain in level flight at its optimum operating speed.

This may increase minimum hourly fuel consumption and reduce maximum endurance.

Greater Weight → Higher Minimum Power

Level Turns

During a sustained, coordinated level turn, bank angle increases the required total lift.

The resulting higher load factor can increase induced drag and the power needed to maintain altitude.

More Bank → More Lift Required in a Level Turn
Wings Level 30° Bank Load Factor: 1.00g Load Factor: ≈1.15g
Hover over the diagram to enlarge
Understanding the Illustration

In straight-and-level flight, the load factor is approximately 1.00g. In a coordinated level turn with 30° of bank, the load factor increases to approximately 1.15g.

This means the wing must produce about 15% more total lift than in straight-and-level flight at the same weight. It does not mean fuel consumption automatically increases by 15%.

The effect on endurance depends on the additional drag, engine power, and actual fuel flow.

3. Turbulence and Aircraft Configuration

Turbulence and configuration changes can influence the power required to maintain a stable flight condition. Their effects are not identical, but both may reduce fuel efficiency.

Turbulence

Turbulence produces rapid changes in airflow, angle of attack, airspeed, and aircraft attitude.

Maintaining controlled flight may involve power adjustments and changes in aerodynamic drag.

These variations can affect fuel consumption. The actual endurance penalty depends on conditions and pilot response.

Priority: Safe Turbulence Penetration

Flaps and Landing Gear

Flaps change wing lift and drag characteristics. Larger flap deflections generally produce substantial additional drag.

Extended landing gear also increases parasite drag.

Such configurations can require additional power to maintain level flight, potentially reducing endurance.

Use the Approved Flight Configuration
Operating in Turbulence

Do not attempt to minimize fuel consumption at the expense of controllability or structural operating limitations.

Use appropriate airspeeds and procedures from the AFM/POH when operating in turbulent conditions.

4. Altitude, Air Density, and Temperature

Altitude and temperature influence air density, engine performance, propeller efficiency, and the power required for a particular flight condition.

The altitude that provides the longest endurance is not necessarily the same for every airplane. Engine type, available power, fuel efficiency, and propeller characteristics all matter.

Air Density

Changes in density affect the relationship between indicated airspeed, true airspeed, and aerodynamic performance.

Engine Performance

Normally aspirated engines lose available power as altitude increases. Fuel consumption also changes with the selected setting.

Operating Altitude

Compare aircraft-specific fuel-flow and performance data rather than assuming one altitude always gives maximum endurance.

Is Maximum Endurance Always Achieved at Sea Level?

No universal altitude can be specified for every piston-engine airplane. Although simplified aerodynamic models may favor lower altitudes under certain assumptions, actual fuel efficiency depends on the engine and propeller operating conditions.

Use the AFM/POH performance data for the aircraft. When deciding whether to climb, include the time and fuel needed to reach the new altitude.

5. Mixture and Engine Fuel Efficiency

In a piston-engine airplane equipped with a mixture control, the fuel-air mixture affects engine operation and fuel flow.

Appropriate mixture adjustment can improve endurance when performed according to the aircraft and engine manufacturer's procedures.

Leaning is not simply a matter of reducing fuel flow as much as possible. Engine operating temperatures, power output, smoothness, and manufacturer limitations must all be considered.

Correct Mixture Management

Follow AFM/POH instructions for the selected altitude and power setting.

Use available engine instruments and approved procedures to verify proper operation.

Better Fuel Economy Depends on Correct Operation

Avoid Generic Leaning Rules

Carbureted, fuel-injected, turbocharged, and electronically controlled engines can require different procedures.

Do not assume that one RPM change or mixture indication applies to all aircraft.

Always Follow Aircraft-Specific Procedures

6. Wind and Remaining Fuel

Wind has a different effect on endurance than on range. At an unchanged airspeed, power setting, and fuel flow, a headwind or tailwind does not directly change the time the airplane can remain airborne.

However, wind affects the distance traveled over the ground and can change the time needed to reach a suitable landing airport.

Airborne Endurance

Determined primarily by available fuel and hourly fuel consumption.

Wind alone does not alter this time when fuel flow remains unchanged.

Endurance: Time Available

Practical Landing Options

Strong headwinds can increase the time required to reach an airport.

The pilot must consider groundspeed, distance, and the fuel needed to land safely.

Flight Planning: Time Required
Protect the Fuel Needed to Land

Theoretical maximum endurance is not the amount of time a pilot should plan to remain airborne.

Always preserve the fuel needed to reach a suitable landing airport, meet applicable reserve requirements, and allow for appropriate additional margins.

Practical Endurance Management

When endurance becomes an operational concern, the pilot should assess both the fuel remaining and the time needed to complete the flight safely.

✓

Verify fuel remaining. Compare the estimated fuel on board with actual consumption and available indications.

✓

Monitor actual fuel flow. Account for changes in power setting, engine operation, and flight conditions.

✓

Maintain safe operating conditions. Do not sacrifice stall margin, controllability, or compliance with aircraft limitations to reduce fuel consumption.

✓

Evaluate landing alternatives. Consider groundspeed, remaining distance, weather, and required fuel reserves.

✓

Make decisions early. If available fuel may be insufficient for the plan, arrange a timely diversion rather than attempting to extend flight to the limit.

Key Takeaway

Maximum endurance depends on the available fuel and the lowest achievable safe hourly fuel consumption. Weight, maneuvers, turbulence, configuration, altitude, and engine efficiency can change that consumption. Wind primarily affects the distance traveled rather than endurance itself. Always use aircraft-specific performance data and protect the fuel required for a safe landing.

Aircraft Performance — AFM/POH Calculations

Calculating Range and Endurance Using the POH

The Aircraft Flight Manual or Pilot's Operating Handbook (AFM/POH) provides aircraft-specific performance information for different operating conditions. It may include cruise performance tables, fuel consumption data, and range or endurance charts.

To use these figures correctly, pilots must understand how to select the appropriate altitude, temperature, engine power, airspeed, and fuel flow. They must also distinguish between published aircraft range and distance calculated for a particular flight.

Cruise Performance Tables

These tables allow pilots to identify the expected true airspeed and hourly fuel consumption at a selected engine setting.

How Fast and How Much Fuel?

Range Performance Charts

These graphs show how the distance an airplane can travel varies with flight conditions, such as altitude and engine power.

How Far Can the Aircraft Travel?

1. How to Read a Cruise Performance Table

Consider the cruise performance table for a Cessna 172R. The published conditions specify an aircraft weight of 2,450 pounds and the recommended lean mixture at all altitudes.

The table is organized by pressure altitude and engine RPM. For each temperature condition, it provides percent brake horsepower (% BHP), true airspeed (KTAS), and fuel consumption (GPH).

Cessna 172R cruise performance table showing altitude, RPM, engine power, true airspeed and fuel consumption at three temperature conditions
1

Find the Pressure Altitude

Look at the leftmost column labeled PRESS ALT FT. Locate the group corresponding to 4,000 ft.

2

Select the Engine RPM

Within the 4,000 ft group, find the row corresponding to 2,200 RPM.

3

Choose the Temperature

Find the column group labeled STANDARD TEMPERATURE. Do not use values from the 20°C below or 20°C above standard columns.

4

Read the Performance Values

Follow the 2,200 RPM row across the standard-temperature columns. Read 70% BHP, 111 KTAS, and 8.1 GPH.

5

Check the Published Note

The published cruise speeds assume speed fairings. Without speed fairings, the note instructs pilots to subtract 2 knots from the cruise speeds.

4,000 ft + 2,200 RPM + Standard Temperature = 70% BHP · 111 KTAS · 8.1 GPH

Extracting the Values into a Cruise Table

Aircraft Cessna 172R
Pressure Altitude 4,000 ft
Temperature Standard
RPM % BHP KTAS GPH NM/gal
2,100 62% 105 7.1 14.8
2,200 70% 111 8.1 13.7
2,250 75% 114 8.6 13.3
RPM, % BHP, KTAS, and GPH are taken from the displayed Cessna 172R table at 4,000 ft and standard temperature. NM/gal is calculated from KTAS divided by GPH.

Interpreting the Selected Row

At 2,200 RPM, the airplane is expected to travel at 111 KTAS while consuming 8.1 gallons per hour under the stated conditions.

Dividing 111 by 8.1 gives approximately 13.7 nautical miles per gallon in still air.

Notice that the 2,100 RPM setting gives a lower airspeed but more nautical miles per gallon among these three settings.

Important Details

KTAS is not KIAS. The published speeds are true airspeeds.

A dash is not a zero. A missing table entry should not be treated as a published performance value.

Mixture matters. The stated fuel flows assume the manufacturer's recommended lean mixture.

2. How to Read a Range-versus-Altitude Graph

A range graph shows how the distance an airplane can travel varies with altitude and engine power.

In this graph, the horizontal axis shows range in nautical miles, while the vertical axis shows altitude in feet. The curves represent 75%, 65%, 55%, and 45% power.

Range versus altitude graph showing range in nautical miles on the horizontal axis, altitude in feet on the vertical axis, and curves for 75, 65, 55 and 45 percent power
1

Find the Altitude

Start with the vertical altitude scale. Locate 4,000 ft on the left side of the graph.

2

Move Horizontally

From 4,000 ft, move horizontally to the right until you reach the selected power curve.

3

Select 55% Power

Find the curve labeled 55% POWER. At 4,000 ft, it intersects the altitude line near the 400 NM position.

4

Read the Range

From the intersection, move vertically down to the horizontal axis. The range is approximately 400 nautical miles.

5

Compare Another Power Setting

Repeat the procedure at 4,000 ft using the 45% POWER curve. The indicated range is approximately 425 NM.

4,000 ft → 55% Power → Approximately 400 NM
75% Power ≈345 NM

Approximate range at 4,000 ft.

55% Power ≈400 NM

Approximate range at the same altitude.

45% Power ≈425 NM

Approximate range at the same altitude.

Understanding the Range Curves

At 4,000 ft, the lower power settings correspond to a greater plotted range. Compare the horizontal positions of the power curves to see the difference.

The FULL THROTTLE indication also shows that the power available from the engine changes with altitude.

A lower power setting may improve range but also result in a lower cruising speed and a longer flight time.

Use Compatible Performance Data

The range graph does not identify the airplane, fuel quantity, reserves, or complete operating assumptions in the portion shown.

Its range readings must therefore not be combined directly with the Cessna 172R cruise-performance values. For an actual flight, use charts applicable to the same aircraft and operating conditions.

3. Determine the Fuel Available for Cruise

When using a cruise-performance table rather than a complete range chart, determine how much usable fuel is available for level flight after allowing for the other flight phases, required reserves, and additional margins.

The following calculation assumes 40 gallons of usable fuel at departure. The fuel allocation is hypothetical; the cruise performance comes from the Cessna 172R table.

Illustrative Fuel Allocation

40 gal Usable fuel at departure
1 gal Taxi and takeoff
3 gal Climb
28 gal Allocated cruise fuel
1 gal Descent and approach
5 gal Protected reserve
2 gal Additional margin
40 − 1 − 3 − 1 − 5 − 2 = 28 gallons for cruise
Fuel Allowances and Reserves

These allocations are teaching assumptions, not recommended fuel planning values.

For an actual flight, estimate fuel consumption during each phase from the applicable AFM/POH and preserve the required reserves and appropriate additional margins.

4. Calculate Cruise Endurance and Still-Air Distance

Use the selected Cessna 172R performance values: 111 KTAS and 8.1 GPH, with 28 gallons hypothetically allocated to level cruise.

Divide the fuel quantity by hourly fuel flow to estimate cruise endurance. Multiply that time by true airspeed to calculate the distance in still air.

Available Cruise Time 3 h 27 min 28 ÷ 8.1
≈ 3.46 hours
Cruise True Airspeed 111 kt From the Cessna 172R cruise-performance table
Still-Air Cruise Distance 384 NM 111 × (28 ÷ 8.1)
≈ 383.7 NM
Interpreting the Result

The approximately 384 NM represents the distance associated with the allocated level-cruise fuel under the stated operating and still-air assumptions.

It is not a certified maximum-range figure and does not represent the airplane's total takeoff-to-landing distance.

5. Apply the Expected Wind

Still-air calculations use true airspeed. To estimate ground distance, use the expected groundspeed.

Assume a constant 15 kt direct headwind during cruise. The airplane maintains 111 KTAS and 8.1 GPH for this example.

Calculate Groundspeed

Subtract the direct headwind component from true airspeed.

111 − 15 = 96 kt GS

Calculate Ground Distance

Multiply groundspeed by the available cruise time.

96 × (28 ÷ 8.1) ≈ 332 NM
Wind-Corrected Cruise Distance Ground Distance = Groundspeed × Cruise Time

The headwind reduces the estimated cruise distance from approximately 384 NM to approximately 332 NM.

Can the Aircraft Complete a 250 NM Cruise Segment?

At 96 kt groundspeed, a 250 NM cruise segment would take approximately 2 hours 36 minutes.

At 8.1 GPH, expected cruise consumption would be approximately 21.1 gallons.

Under the hypothetical fuel allocation, approximately 13.9 gallons would remain at landing, including the protected reserve and additional margin.

6. Verify the POH Performance Assumptions

Before using any performance data for actual flight planning, verify that the figures apply to the airplane and the expected operating conditions.

✓

Aircraft and weight: Use the applicable AFM/POH and check the stated aircraft weight.

✓

Altitude and temperature: Select the appropriate pressure altitude and temperature condition.

✓

Engine settings: Confirm RPM, power, mixture procedure, and operating limitations.

✓

Aircraft configuration: Apply any published performance corrections, including speed-fairing adjustments when applicable.

✓

Fuel allowances: Determine whether climb, descent, and reserves are already included in published range figures.

✓

Wind and fuel consumption: Update groundspeed, flight time, and fuel estimates when actual conditions change.

Key Takeaway

Read the AFM/POH conditions first, then select the correct performance values. A cruise table provides airspeed and fuel consumption for specified settings, while a range graph shows distance under its own assumptions. Determine the fuel available, calculate time and distance, account for wind, and preserve all required fuel reserves.

Aircraft Performance — Range and Endurance

Maximum Range vs. Maximum Endurance: Summary

Maximum range and maximum endurance are two different aircraft performance objectives. Both involve fuel efficiency, but they measure different results.

Range measures how far an aircraft can travel, while endurance measures how long it can remain airborne. The operating condition that maximizes one does not necessarily maximize the other.

Maximum Range

The objective is to cover the greatest distance using the available fuel.

Fuel efficiency is evaluated in nautical miles per gallon (NM/gal).

How far can the airplane fly?

Maximum Endurance

The objective is to remain airborne for the greatest possible amount of time using the available fuel.

The key consideration is fuel consumed per hour (GPH).

How long can the airplane stay airborne?

1. Key Differences Between Range and Endurance

The following comparison summarizes the concepts for a typical propeller-driven training airplane.

Characteristic Maximum Range Maximum Endurance
Primary Objective Travel the greatest distance Remain airborne the longest
Performance Measure Distance per gallon Flight time per gallon
Key Calculation TAS ÷ GPH in still air Fuel available ÷ GPH
Aerodynamic Reference Approximately minimum drag, or maximum L/D, under simplified propeller-aircraft assumptions Approximately minimum power required under simplified propeller-aircraft assumptions
Relative Airspeed Generally higher Generally lower
Effect of Wind Changes ground distance per gallon Does not directly change airborne time at unchanged fuel flow
Result Nautical miles Hours and minutes

2. Why the Best Speeds Are Different

In a simplified model of a propeller-driven airplane, maximum endurance occurs near the speed requiring the least aerodynamic power, whereas maximum still-air range occurs near the speed producing minimum drag or maximum lift-to-drag ratio.

The minimum-power speed is typically lower than the minimum-drag speed. The diagram shows their relative positions, not actual speeds for a particular aircraft.

Relative Best-Endurance and Best-Range Speeds

Best Endurance Minimum Power Best Range Minimum Drag Lower Speed Higher Speed

Read the scale from left to right, toward increasing airspeed. The minimum-power condition appears first; the minimum-drag condition occurs at a higher airspeed.

Actual optimum speeds depend on engine efficiency, propeller efficiency, aircraft weight, altitude, and other operating conditions. Use aircraft-specific performance information rather than the positions in this diagram.

Conceptual illustration for a typical propeller-driven airplane. Not drawn to a numerical airspeed scale.

3. Same Aircraft, Different Objectives

Consider three hypothetical cruise settings for the same light airplane. Assume 18 gallons are available specifically for level cruise, after separately accounting for other flight phases and required fuel reserves.

Compare the distance per gallon and the estimated cruise duration at each operating setting.

Comparing Three Cruise Settings

Setting TAS Fuel Flow NM/gal Time with 18 gal
Lower Speed 90 kt 6.0 GPH 15.0 3 h 00 min Longest Time
Moderate Speed 110 kt 7.0 GPH 15.7 Best NM/gal 2 h 34 min
Higher Speed 125 kt 9.5 GPH 13.2 1 h 54 min
All data are hypothetical. Results are rounded. The highlighted settings are the best among these three choices, not proven maximum-range or maximum-endurance speeds for an actual aircraft.

Best Range of the Three Settings

110 kt · 7.0 GPH

At this setting, the airplane travels approximately 15.7 NM per gallon in still air.

This is slightly more distance per gallon than at 90 kt, even though fuel flow is higher.

Best Endurance of the Three Settings

90 kt · 6.0 GPH

At this setting, 18 gallons allow approximately 3 hours of level flight.

The airplane stays airborne longer because it consumes less fuel per hour, even though it travels more slowly.

Why Doesn't the Faster Airplane Always Go Farther?

A higher airspeed increases the distance covered each hour, but it may require disproportionately more fuel. If fuel flow increases faster than speed, distance per gallon decreases.

Similarly, maximum endurance cannot be found by simply choosing the lowest possible airspeed. At sufficiently low speeds, induced drag and power required increase again.

4. Which Objective Matters in Flight?

The appropriate operating condition depends on the purpose of the flight and the surrounding circumstances.

Traveling a Long Distance

When fuel efficiency over a long route is important, the pilot considers how many nautical miles can be traveled per gallon of fuel.

Focus: Maximum Range

Remaining Airborne Temporarily

When holding or delaying a landing, the pilot may need to conserve fuel while maintaining safe flight conditions and adequate landing reserves.

Focus: Endurance

Flying with a Strong Headwind

Groundspeed becomes especially important. The best speed for distance over the ground may differ from the best still-air range speed.

Focus: Wind-Corrected Range
Maximum Performance Is Not a Fuel-Planning Target

Theoretical maximum range and endurance describe performance limits under specified assumptions. They do not justify planning to use all available fuel.

Always use the AFM/POH, account for the actual route and operating conditions, and preserve required fuel reserves and suitable additional margins.

Key Takeaway

Maximum range is about distance; maximum endurance is about time. For a typical propeller-driven airplane, best endurance generally occurs at a lower airspeed than best still-air range. The final operating choice must be based on aircraft-specific performance data, wind conditions, fuel availability, and safe flight requirements.

Pre-Flight Knowledge Check

Range and Endurance Review Questions

Test your understanding of aircraft range, endurance, aerodynamic efficiency, fuel consumption, and AFM/POH performance calculations. These questions help you apply the concepts covered in this lesson to practical flight situations.

How to Use These Review Questions

Try to answer each question before opening the explanation. Pay particular attention to the difference between maximizing distance and maximizing flight time, and to the assumptions used in aircraft performance charts.

Part 1 — Range, Endurance and Aerodynamic Efficiency

Review the difference between range and endurance, the aerodynamic conditions associated with each, and the effects of airspeed and wind.

What is the difference between maximum range and maximum endurance?
Answer & Explanation

Maximum range is the greatest distance an aircraft can travel using a given amount of fuel. It is concerned with distance per unit of fuel.

Maximum endurance is the longest time an aircraft can remain airborne using a given amount of fuel. It is concerned with minimizing hourly fuel consumption.

Remember

Range is measured in distance, usually nautical miles. Endurance is measured in hours and minutes.

Why are the best-range and best-endurance speeds generally different in a propeller-driven airplane?
Answer & Explanation

Under simplified assumptions of constant engine and propeller efficiency, best still-air range occurs near the speed of minimum drag, corresponding to maximum L/D.

Best endurance occurs near the speed of minimum power required, which is typically lower.

Actual optimum speeds depend on the aircraft, engine, propeller, and operating conditions.

Why doesn't flying as slowly as possible always provide maximum endurance?
Answer & Explanation

At very low airspeeds, the wing must operate at a higher angle of attack to generate sufficient lift. Induced drag becomes high.

Maintaining level flight may then require more power, even though the airplane is moving more slowly.

The best-endurance condition is associated with minimum safe hourly fuel consumption, not the lowest possible airspeed.

Safety Decision

Never reduce airspeed below a safe operating margin merely to conserve fuel. Follow aircraft-specific operating procedures.

How does a headwind affect aircraft range and endurance?
Answer & Explanation

A headwind reduces groundspeed for a given true airspeed. The airplane therefore covers less distance over the ground during a particular time.

If fuel flow remains unchanged, the airplane can remain airborne for the same duration. However, it travels fewer nautical miles during that time.

Wind can also change the airspeed that provides the greatest distance over the ground per gallon.

Remember

Wind directly affects groundspeed and ground range. It does not directly change fuel-limited airborne time when fuel flow is unchanged.

Part 2 — Reading AFM/POH Performance Data

Practice interpreting cruise-performance tables, fuel-flow figures, and range-versus-altitude graphs.

Using the Cessna 172R cruise table, what performance values are shown at 4,000 ft, 2,200 RPM, and standard temperature?
Answer & Explanation

Locate the 4,000 ft pressure-altitude group, then the 2,200 RPM row.

Under Standard Temperature, the table gives: 70% BHP, 111 KTAS, and 8.1 GPH.

These values apply to the published conditions, including the specified weight and recommended lean mixture.

At 4,000 ft and standard temperature, which Cessna 172R setting gives more nautical miles per gallon: 2,100 RPM or 2,200 RPM?
Answer & Explanation

At 2,100 RPM, the table gives 105 KTAS and 7.1 GPH.

105 ÷ 7.1 ≈ 14.8 NM/gal

At 2,200 RPM, the table gives 111 KTAS and 8.1 GPH.

111 ÷ 8.1 ≈ 13.7 NM/gal

The 2,100 RPM setting provides greater still-air distance per gallon between these two settings, although the airplane travels more slowly.

Remember

Greater cruise speed does not necessarily mean greater fuel efficiency. Compare TAS divided by GPH.

How do you read the range-versus-altitude graph to estimate range at 4,000 ft and 55% power?
Answer & Explanation

Find 4,000 ft on the vertical altitude axis. Move horizontally until you intersect the curve labeled 55% POWER.

From that intersection, move vertically down to the horizontal range scale.

The indicated distance is approximately 400 nautical miles.

The value is approximate because it is read from a plotted curve. Its practical use also depends on the graph's aircraft, fuel, and reserve assumptions.

Why must pilots avoid combining performance figures from different aircraft charts without checking their assumptions?
Answer & Explanation

Performance charts may refer to different aircraft models, weights, fuel quantities, mixture settings, altitudes, or reserve allowances.

A cruise table may describe steady level-flight performance, while a range chart may already include climb fuel and specified reserves.

Combining unrelated figures can produce an incorrect estimate of available distance or flight time.

Safety Decision

Always use the applicable AFM/POH and read the chart conditions and notes before applying performance data to a flight.

Part 3 — Fuel Calculations and Practical Decisions

Apply cruise fuel flow, true airspeed, wind corrections, and fuel reserve considerations to realistic planning situations.

If 28 gallons are allocated to level cruise at 8.1 GPH, how much cruise time is available?
Answer & Explanation

Divide the allocated cruise fuel by the hourly fuel consumption.

28 gal ÷ 8.1 GPH ≈ 3.46 hours

The result is approximately 3 hours and 27 minutes of level cruise.

This assumes a constant fuel flow and that the 28 gallons have already been allocated after accounting for other flight phases and required reserves.

At 111 KTAS and 8.1 GPH, what still-air cruise distance is available from 28 gallons?
Answer & Explanation

First calculate the cruise time:

28 ÷ 8.1 ≈ 3.46 hours

Then multiply cruise time by true airspeed:

111 × (28 ÷ 8.1) ≈ 384 NM

The estimated distance is approximately 384 nautical miles in still air.

Remember

This is the estimated level-cruise distance under the stated assumptions, not the airplane's entire takeoff-to-landing range.

If the airplane cruises at 111 KTAS with a direct 15 kt headwind, how does the estimated ground distance change?
Answer & Explanation

First subtract the headwind from true airspeed to obtain groundspeed.

111 − 15 = 96 kt GS

With 28 gallons allocated to cruise at 8.1 GPH, the available cruise time remains approximately 3.46 hours.

96 × (28 ÷ 8.1) ≈ 332 NM

The estimated ground cruise distance decreases from about 384 NM in still air to 332 NM with the headwind.

A pilot's actual fuel consumption is higher than expected and a headwind is stronger than forecast. What should the pilot do?
Answer & Explanation

The pilot should recalculate the expected fuel needed to complete the route using the observed fuel flow and actual groundspeed.

Compare the revised fuel requirement with the usable fuel remaining, preserving all required reserves and appropriate additional margins.

If the original plan no longer provides sufficient fuel margin, the pilot should select a suitable alternate landing airport and divert in time.

Safety Decision

Do not continue toward the planned destination merely because the airplane's theoretical maximum range appears sufficient. Make fuel-management decisions early.

Pre-Flight Review Complete — Range and Endurance

Maximum range concerns distance; maximum endurance concerns time. Both depend on aircraft performance, fuel consumption, and operating conditions. Understanding the difference is essential, but the practical skill is knowing how to read aircraft-specific AFM/POH data, calculate fuel requirements, account for wind, and make safe decisions before fuel margins become critical.

error:
Study flight
Logo